Budget vs Actual: What Should a Useful Variance Review Actually Show?
What a useful budget vs actual review shows beyond the dollar variance: volume and price, timing or permanent, commentary, actions and an updated forecast.
Key takeaways
- A dollar variance tells you how much results missed the budget. A useful review tells you why, whether it will reverse, and what changes as a result.
- Split the big variances into their causes: for revenue, volume and price; for margins, volume and cost per unit.
- Sort every big variance into timing (it reverses) or permanent (it doesn’t). Only permanent ones change the forecast.
- Watch costs that come in under budget because sales were lower. Compared with a flexed budget, they can be worse, not better.
- End every review with an action and an updated forecast. Otherwise it’s just reporting.
The question I usually get, on the first working day of the month: “Revenue came in 8% under budget. Is that a problem, or just a bad month?”
The dollar variance can’t tell you. A useful budget vs actual review answers three questions for every big gap: why it happened, whether it will reverse, and what changes as a result — in the business and in the forecast.
That matters because the two kinds of miss call for opposite responses. An order that slipped by two days needs nothing but patience. A customer who has cut their order for good, or a supplier who has raised prices, needs a decision — and the earlier it’s made, the less it costs.
This piece walks through what a useful review shows, one step at a time, on one month. It assumes you already have a budget and a monthly profit and loss statement; our free Budget vs Actual Dashboard does the arithmetic below for every line, month and year to date.
The model is simple:
Example: the Roaster’s March
A business with revenue 8% below budget, a gross margin 3 points lower, and payroll exactly on plan.
Let’s take a wholesale coffee roaster — I’ll call it the Roaster — that sells cases of coffee to cafés, budgeting 5,000 cases a month at $100 a case, with beans and packaging costing $60 a case. That’s about $6 million of revenue a year.
| March | Budget | Actual | Variance | % |
|---|---|---|---|---|
| Cases sold | 5,000 | 4,600 | −400 | −8.0% |
| Revenue | $500,000 | $460,000 | −$40,000 | −8.0% |
| Cost of goods sold | $300,000 | $289,800 | −$10,200 | −3.4% |
| Gross profit | $200,000 | $170,200 | −$29,800 | −14.9% |
| Gross margin | 40.0% | 37.0% | −3.0 pts | |
| Payroll | $90,000 | $90,000 | — | — |
| Rent and other overhead | $60,000 | $60,000 | — | — |
| Operating profit | $50,000 | $20,200 | −$29,800 | −59.6% |
A plain budget vs actual report stops here. It says revenue missed, costs came in $10,200 under budget, and profit fell by more than half. Two of those three statements mislead: costs weren’t really under budget, and not all of the profit fall will last.
Step 1: Pick the variances worth explaining
Not every line deserves a paragraph. Set a threshold in both dollars and percentage, and explain only the lines that clear both.
The Roaster reviews any line that’s more than $5,000 and more than 5% away from budget. That’s a parameter for this business, not a rule — a smaller business might use $1,000 and 10%. Using both stops a large but routine wobble on a big line, or a large percentage on a tiny one, from taking up the meeting.
This month, revenue, gross profit and operating profit clear the bar. Payroll and overhead don’t — they’re on plan. Cost of goods sold doesn’t either: it’s $10,200 away, but only 3.4%. That’s exactly why step 3 looks underneath it.
Step 2: Split revenue into volume and price
A revenue variance has two causes: you sold a different number of units, or at a different price. Separate them, because they have different fixes.
| Revenue variance | How it’s measured | March |
|---|---|---|
| Volume | (actual cases − budget cases) × budget price | −400 × $100 = −$40,000 |
| Price | (actual price − budget price) × actual cases | $0 × 4,600 = $0 |
| Total | −$40,000 |
All of the Roaster’s revenue miss is volume. Prices held. If you sell more than one product, a third piece — mix, selling more of the cheaper or the dearer products than planned — can matter too. Volume and price are the place to start.
Step 3: Check costs against a flexed budget
Compare costs with the budget recalculated at the volume you actually sold. Otherwise lower sales make costs look good.
Cost of goods sold came in $10,200 under budget — but only because the Roaster sold 400 fewer cases. At the 4,600 cases it actually sold, the budget would have been 4,600 × $60 = $276,000. Actual was $289,800: $13,800 worse, because each case cost $3 more. A green coffee price increase from its main importer.
So the $29,800 fall in gross profit has two causes:
| Gross profit variance | How it’s measured | March |
|---|---|---|
| Volume | −400 cases × $40 budget margin a case | −$16,000 |
| Cost per case | −$3 × 4,600 cases | −$13,800 |
| Total | −$29,800 |
Step 4: Sort each variance into timing or permanent
Ask of every big variance: will it reverse on its own? If yes, it’s timing. If no, it’s permanent — and it belongs in the forecast.
The Roaster’s sales team explains the 400 missing cases:
| Cause | Cases | Gross profit | Timing or permanent? |
|---|---|---|---|
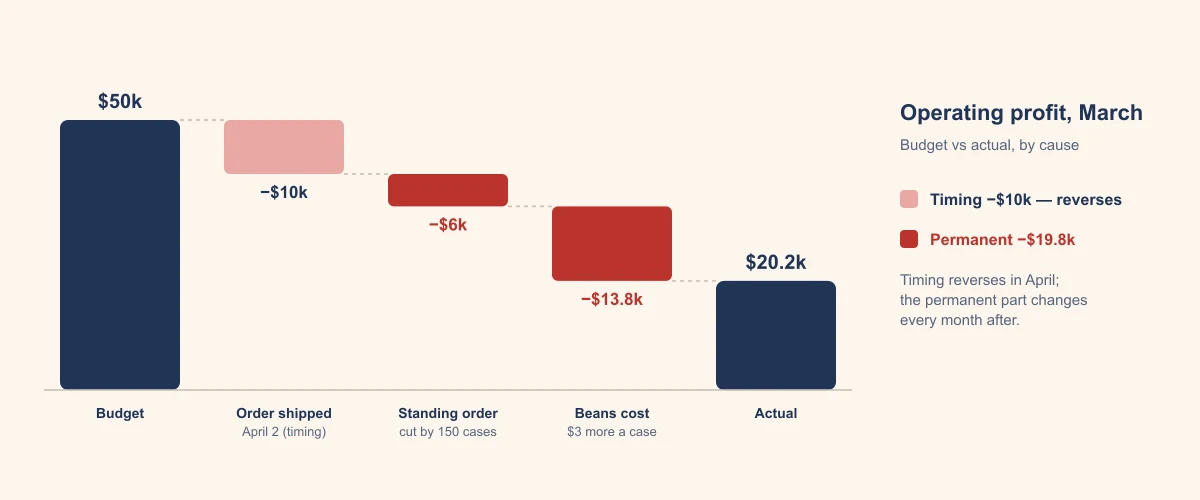
| A café group’s order shipped on April 2 instead of March 31 | 250 | −$10,000 | Timing — lands in April |
| A café chain cut its standing order, starting this month | 150 | −$6,000 | Permanent |
| Beans cost $3 a case more | — | −$13,800 | Permanent |
| Total | 400 | −$29,800 |
$10,000 of the miss will reverse in April. $19,800 won’t. Those are very different months.
Step 5: Write the owner’s commentary
Three or four sentences per big variance, in plain words: what happened, why, timing or permanent, and what you’re doing about it.
Numbers without commentary get read differently by everyone in the room. For the Roaster:
- Revenue −$40,000 (−8%). All volume; prices held. 250 cases for a café group shipped on April 2 — timing, recovered in April. A café chain has cut its standing order by 150 cases a month — permanent.
- Gross margin 37% vs 40%. Our importer raised green coffee prices by $3 a case from March 1. Permanent unless we reprice or find another supplier. Cost of goods sold looks $10,200 favorable only because volume was lower.
- Payroll and overhead on plan. No action.
Step 6: Decide the actions
Every permanent variance needs an owner and a decision. Otherwise the same variance comes back next month, and the month after.
- Bean cost. At $63 a case, holding a 40% gross margin needs a price of $63 ÷ 0.6 = $105 — a 5% increase. The Roaster decides to raise prices by 5% from May, giving cafés a month’s notice, and asks a second importer for a quote.
- The smaller standing order. Sales calls the café chain to find out why, and looks for 150 cases a month of new business.
- The late order. Nothing to do, except confirm it shipped.
Step 7: Update the forecast
Put the permanent variances into the forecast and leave the timing ones to reverse. The forecast — not the original budget — is what you plan cash and decisions against from here.
| Forecast | Original budget | April | May onward, after the price rise |
|---|---|---|---|
| Cases | 5,000 | 5,100 | 4,850 |
| Price a case | $100 | $100 | $105 |
| Revenue | $500,000 | $510,000 | $509,250 |
| Gross profit | $200,000 (40%) | $188,700 (37%) | $203,700 (40%) |
| Operating profit | $50,000 | $38,700 | $53,700 |
April gets the 250 delayed cases back but loses the 150 cases a month, and still carries the higher bean cost. From May, the price rise brings the margin back to 40% — if the cafés accept it and none of them leave. That’s an assumption to test against May’s actual results, which is what next month’s review is for.
The budget stays where it is, as the plan you measure against. The forecast moves. How often to roll it forward, and how far, is in weekly or monthly.
The line I check first in any budget vs actual pack is a cost that’s under budget while revenue is down. It’s almost always reported as good news. Flex the budget to the volume you actually sold and it’s often the opposite — a cost per unit that has quietly gone up, sitting inside a total that looks fine.
What a useful review looks like on one page
The standard budget vs actual report, plus six things that turn it into decisions.
| What the review shows | Plain report | Useful review |
|---|---|---|
| Actual, budget and variance, in dollars and percent | ✓ | ✓ |
| Only the variances above your threshold, each explained | — | ✓ |
| Revenue split into volume and price (and mix, if you sell several products) | — | ✓ |
| Costs compared with a flexed budget | — | ✓ |
| Each variance marked timing or permanent, with commentary | — | ✓ |
| An action and an owner for every permanent variance | — | ✓ |
| An updated forecast for the months ahead | — | ✓ |
If the numbers underneath are wrong, none of this helps — a misposted invoice shows up as a variance and wastes the meeting. Twelve signs your books need a cleanup is the check to run first.
Start this week
Take last month’s budget vs actual report and do steps 1 to 4 for the three largest variances.
- Set a threshold in dollars and percent, and list the lines above it.
- Split each revenue variance into volume and price.
- Flex the cost lines to the volume you actually sold.
- Mark each variance timing or permanent, and move the permanent ones into next month’s forecast.
Our free Budget vs Actual Dashboard produces the line-by-line variances for the month and the year to date from your own P&L export — the starting point for everything above.
If you’d like a second pair of eyes on your variances, email me at anant@ease.pro. I hope you have a great day.
Want a monthly review that leads to decisions?
The report is the easy part. Explaining each variance, separating timing from permanent, and turning it into actions and an updated forecast is the work. If you’d like experienced finance professionals to run that review with you every month, that’s our FP&A work.
Frequently asked questions
What is a budget vs actual report?
A report that sets what actually happened against what was budgeted, line by line, for a month and for the year to date. For each line it shows the actual, the budget, the difference in dollars and the difference as a percentage, so you can see where results departed from the plan.
What is budget variance analysis?
Working out why actual results differed from budget, not just by how much. A useful analysis splits the big variances into their causes — for revenue, how much came from selling more or fewer units and how much from price — and says whether each one will reverse next month or is permanent.
What is a favorable and an unfavorable variance?
A favorable variance improves profit compared with budget: revenue above plan, or a cost below it. An unfavorable variance reduces profit: revenue below plan, or a cost above it. Watch the cost lines carefully — a cost can come in below budget only because sales were lower, which is not good news.
What is the difference between a timing and a permanent variance?
A timing variance reverses: an order that shipped two days after month-end, or a bill that arrived early. It moves results between months without changing the year. A permanent variance doesn't reverse: a lost customer, a price cut, a supplier cost increase. Permanent variances are the ones that should change your forecast.
What is a flexed budget?
The budget recalculated at the volume you actually achieved. Comparing actual costs with a flexed budget separates what happened because you sold more or less from what happened to costs per unit. A cost that looks favorable against the original budget can turn out unfavorable once the budget is flexed.
How often should a small business review budget vs actual?
Monthly, once the books for the month are closed. Look at the lines where the variance is large in both dollars and percentage, explain each one, decide what to do about it, and update the forecast for the months ahead. A review that doesn't change a decision or a forecast hasn't done its job.