Weekly or Monthly Cash Flow Forecast: Which Does Your Business Need?
Weekly catches Friday's payroll. Monthly catches next year's hire. A practical comparison of detail, effort and the decisions each one actually answers.
Key takeaways
- Weekly and monthly forecasts answer different questions. Neither replaces the other.
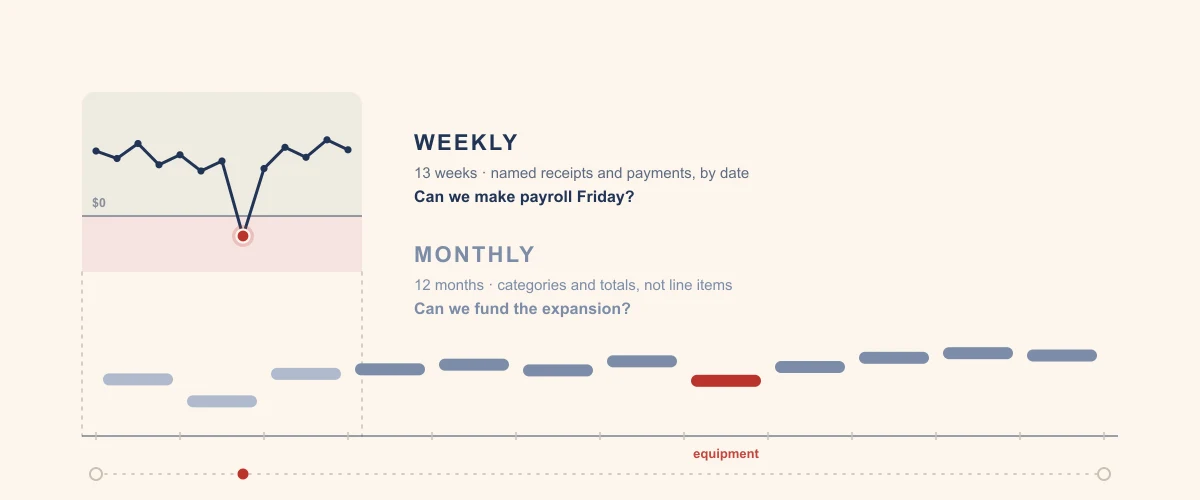
- Weekly — the 13-week forecast — runs day-to-day liquidity: which weeks are tight, how big a working capital line you need, whether AP and AR terms need to change.
- Monthly or multi-year runs expansion decisions — headcount, capex, a second location — and answers whether you can self-fund it or need financing.
- Facing both kinds of decision at once is normal. When you are, the two cadences are one model read two ways, not two jobs.
Someone asks whether they should be forecasting cash weekly or monthly, and the honest answer is: it depends on the decision you are trying to make.
A payroll question and a hiring question are not answered by the same forecast. So let us build it properly — what each cadence is good at, where each one breaks, a single business facing both kinds of decision in the same quarter, and a quick way to tell which one your question needs.
What a cash flow forecast actually does
Strip away the period and a cash flow forecast is one calculation, repeated.
What changes with the period is the question it is able to answer.
Two different jobs, not two versions of the same report
A weekly forecast runs the business day to day. A monthly one runs the decisions sitting above it. Asking either to do the other’s job is where most of the frustration comes from.
A 13-week weekly forecast tells you whether a given week is short, roughly how large a working capital line you actually need, and whether your AP and AR terms are tight enough — or too loose — to get through a normal month without a scare.
A monthly or multi-year forecast runs the decisions above day-to-day operating: expanding headcount, taking on capex, opening a second location. Its job is to tell you whether the business can fund that decision from its own cash generation, or whether you need outside financing — and roughly how much.
Ask the weekly question of a monthly forecast and you get a comfortable average that hides the one bad week. Ask the monthly question of a weekly forecast and you will hand-roll fifty-two weeks of line items to answer something a trended projection settles in a minute. Matching the cadence to the decision is most of the skill.
When an owner tells me their cash flow forecast “isn’t working”, it is almost never wrong — it is answering a different question from the one they are actually asking it. A monthly forecast that never flags a payroll squeeze is not broken. It was never built to see one week at a time.
Weekly vs monthly cash flow forecast, side by side
Three cadences, compared on what actually decides between them: how much detail each carries, how much upkeep it takes, what kind of business it suits, and the decision it is built to support.
| Daily | Weekly | Monthly (rolling) | |
|---|---|---|---|
| Detail | Every transaction, as it happens | Named receipts and payments, by date | Categories and totals, not line items |
| Maintenance | Constant — part of the daily routine | 30–60 minutes, once a week | A few hours, once a month |
| Suits | Tight cash, high transaction volume, an active squeeze | Normal operating cash for most SMBs | Stable cash, longer-horizon decisions |
| Answers | Can I release this payment right now? | Can I make payroll Friday? How big a line do we need, and are our terms right? | Can we self-fund this expansion, or do we need financing — and how much? |
Read that table by its last row first. The decision you are trying to make tells you the cadence you need, not the other way around. A business does not graduate from weekly to monthly, or the reverse. Most keep both running, aimed at different questions.
One week, one quarter — a worked example
Easier to see than to argue. One business, one quarter, two decisions — and each needs a different view to answer.
Meet Bramwell Fabrication: a metal fabrication shop turning over about $3.2M a year with 14 people on staff. Material runs a little under 40% of revenue, payroll about 31%, overhead another 18% — which leaves roughly $35,000 a month of operating cash in a normal month. A perfectly ordinary small job shop.
The weekly question: can we make Friday?
Bramwell runs biweekly payroll and pays its steel supplier on a running account. This week, payroll and a supplier payment land close together, and the business is waiting on its largest customer — who, across their last six invoices, has paid an average of eight days late.
| Day | What moves | Amount | Cash after |
|---|---|---|---|
| Mon | Opening balance | — | $52,000 |
| Tue | Steel supplier payment, already approved | −$21,000 | $31,000 |
| Wed | Rent and routine overhead | −$9,000 | $22,000 |
| Thu | Customer collection — if on time | +$46,000 | $68,000 |
| Fri | Biweekly payroll | −$38,000 | $30,000 |
| Fri | Same payroll — if the customer is late | −$38,000 | −$16,000 |
Nothing here is a surprise. The supplier payment was approved last week. Payroll is payroll. The only variable is one customer’s timing — and their own payment history already tells you to expect it late.
Only a weekly, date-by-date view sees this collision coming. A monthly forecast would show the month closing comfortably and never mention Friday at all.
Seen on Monday this is a phone call: ask the customer for a partial early payment, or move part of the supplier payment by a few days. Seen on Friday it is an overdraft.
Run this view for a few months and it tells you two more things a monthly report never will:
- How large a working capital line you actually need. If the low week keeps landing $15,000–$20,000 short, that is roughly the facility worth arranging — a number, not a guess.
- Whether AP or AR terms need to change. If the same customer is reliably about a week late, moving them to shorter terms or asking for a deposit fixes the pattern at its source instead of financing around it every cycle.
We covered shortening DSO, DPO and the cash conversion cycle in the guide to cash flow management. If the squeeze looks like it returns every cycle rather than just this one, working capital inefficiency is the piece to read next.
The monthly question: can we afford the repayments?
Separately, and on a completely different clock, Bramwell wants to put $100,000 into new plant to take on a bigger contract.
Equipment is financed over the life of the asset, not over a year or two — a lender will not run a loan past the point where the machine still has resale value, which is why the SBA caps 7(a) equipment loans at ten years unless the asset lasts longer. Over five years, $100,000 at 8% comes to about $2,030 a month.
| Every month, once the plant is running | |
|---|---|
| Extra cash the plant brings in, net of what it costs to run | +$5,000 |
| Repayment on the new loan | −$2,030 |
| Left over | +$2,970 |
The plant services its own loan and leaves about $2,970 a month over. Two things that table does not show, and both are worth knowing before you sign.
The repayment starts before the cash does. Installing the plant and getting the contract running takes about three months; the loan does not wait. Bramwell funds those first three repayments itself — roughly $6,100 out of internal accruals. Comfortable against $35,000 a month, but a number you want in advance rather than by surprise.
The bank tests the whole business, not the machine. Debt service coverage is operating cash flow divided by every loan repayment, existing and proposed — not just the new one. Bramwell already pays $5,470 a month on the building and a truck, so total repayments become $7,500 a month, or $90,000 a year. Against $480,000 of operating cash that is 5.3x, where the SBA’s floor on a small 7(a) loan is 1.10:1 and many commercial lenders want 1.25x. Nowhere near the line.
The monthly view sizes the decision; the weekly view tells you which Friday the $7,500 lands on. It is comfortable against $35,000 a month. It is not comfortable in the week above that already closes at $30,000 with payroll paid — and in the week the big customer pays late, that week closes at −$16,000 before any of it is taken.
Hiring works the same way. Another welder costs roughly $68,000 a year loaded. The test is not whether this month’s cash covers it — it is whether revenue grows fast enough over the next two or three quarters to carry the higher run-rate before the new contract starts paying. That is a trend across months, not a number in a week.
Same business, same quarter, two completely different instruments. The weekly view never needed to know about the equipment loan. The monthly view never needed to know Thursday’s customer payment was late. That is not a gap in either model — it is the two of them doing their actual jobs.
See your own Friday. The free Weekly Cash Decision Calculator turns this week’s cash, bills and expected collections into a pay / collect / delay plan.
Your question decides your cadence
Rather than choosing a cadence first, start from the question you are actually asking. These are the ones owners bring us most.
| Your question | What answers it |
|---|---|
| Can I make payroll this Friday? | Weekly |
| Should I pay this supplier now, or ask for a few more days? | Weekly |
| Which customer do I need to chase this week? | Weekly |
| Is it safe to take an owner distribution this month? | Weekly, checked against the month |
| How big a working capital line do we actually need? | Weekly, trended over a few months |
| Should we tighten AR terms or renegotiate AP? | Weekly, trended over a few months |
| Can we expand headcount, and can we fund it ourselves? | Monthly or multi-year |
| Should we pay cash for this equipment, or finance it? | Monthly or multi-year |
| Will this year’s plan actually generate enough cash? | Monthly (rolling) |
| What do I tell the bank about the next two quarters? | Monthly, with the next 13 weeks in weekly detail |
| We are in a cash crunch right now — what do we do today? | Daily, until it passes |
Notice the pattern. If your question has a specific date attached, you need weekly. If it plays out over months, you need monthly. Daily only earns a place when neither of those is fast enough.
When daily actually makes sense
Daily cash flow forecasting is real and occasionally necessary — but it is a narrow tool, not a default.
An active cash crunch
When the balance is genuinely tight, a week is too slow to react to what changed today.
High transaction volume
A restaurant or retailer reconciling daily till takings already has a daily rhythm to hang it on.
A short-lived event
A funding close, an acquisition integration, a covenant test — anything where one day’s timing genuinely matters.
Outside those cases, daily becomes a maintenance burden that does not pay for itself: a lot of effort to re-confirm what a weekly view already told you. If you are unsure which camp you are in, weekly is almost always the safer default, and you escalate to daily only when a specific week calls for it.
What “rolling” adds to either one
Rolling just means the window moves with you. Each period you drop the one just finished, add a fresh one at the far end, and replace last period’s estimates with what actually happened.
A rolling monthly cash flow forecast does this once a month. A rolling weekly forecast — the 13-week model — does it every week.
Build either one once and let it sit, and it goes stale the moment the first period closes. The window silently narrows while the file still looks full, which is the dangerous part. We covered why that matters, and what makes the habit stick, in why a 13-week cash flow forecast works — the logic is identical whether the window is thirteen weeks or twelve months.
Running both without doubling your work
You do not need two systems. Done well, the weekly and monthly views are one model, read two ways.
- The first 13 weeks, in weekly detail. Named receipts and payments, by date. This answers this week’s and this quarter’s questions.
- Everything beyond that, rolled up to monthly totals. The same underlying assumptions — revenue, collection terms, payroll, overhead — summarised by month instead of itemised by day. This is what you check a hire or a capex purchase against.
- Update the weekly layer every week; revisit the monthly layer once a month. The weekly updates keep correcting near-term accuracy. The monthly layer only needs to move when a real assumption changes.
We have already covered how to build the weekly layer — the step-by-step 13-week build, the data it actually needs, and a worked build from an $80,000 opening balance — so I will not repeat it here. Start with the free 13-week template for the weekly layer; the same assumptions, summarised by month, become your planning view.
If the same squeeze keeps returning no matter which cadence you run, the forecast is not the problem — something structural is. Worth reading whether your cash problem is temporary or structural before building either layer further.
Not sure which layer your business needs first? Email me at anant@ease.pro and I will tell you honestly. I hope you have a great day.
Want both layers built on your actual numbers?
We build the 13-week model from your ledger and real payment behaviour, roll it into a monthly planning view, and run the cadence with your team until it is second nature. You keep the model either way.
Frequently asked questions
What is the difference between a weekly and monthly cash flow forecast?
A weekly cash flow forecast is a date-by-date view of named receipts and payments, built to answer whether you can cover what is due in a specific week. A monthly cash flow forecast works at the category level — revenue, payroll, overhead as totals — built to answer whether the business generates enough cash over a longer stretch to support a planning decision.
What is a rolling monthly cash flow forecast?
A monthly forecast updated every month rather than built once and left static. Each month you drop the one just finished, add a fresh month at the far end, and replace last month's estimate with what actually happened. The window stays the same width; it just keeps moving forward with you.
Do I need a daily cash flow forecast?
Only in specific situations — an active cash crunch, a business with naturally high daily transaction volume like retail or restaurants, or a short-lived event where a single day's timing matters. Outside those cases daily forecasting is usually more maintenance than it is worth, and weekly is the safer default.
How often should a small business forecast its cash flow?
Weekly for operating decisions like payroll and supplier payments, updated every week. Monthly for planning decisions like hiring and capital purchases, revisited whenever a real assumption changes. Most businesses that get this right run both at once rather than picking one.
Can I use the same model for weekly and monthly forecasting?
Yes, and it is the efficient way to do it. Build the near-term window — typically the next 13 weeks — in weekly, date-level detail, and roll everything beyond that up to monthly totals using the same underlying assumptions. You maintain one model and read it two ways.
Which cadence do lenders and investors expect?
It depends what they are asking about. For near-term liquidity, lenders and turnaround professionals typically expect a 13-week weekly forecast, because a receipts-and-payments schedule can be checked line by line against a bank statement. For a business plan, budget or longer-term projection, they expect a monthly or annual view.
How do I decide whether to pay cash or finance an expansion?
Run it as a monthly or multi-year question first: does the expansion pay for itself out of the cash the business generates, and does that still leave a working capital buffer? If paying cash would drain the buffer your weekly forecast depends on to cover ordinary timing gaps, financing the purchase and keeping the cash is usually the safer call, even when you could technically afford it outright.