How Do the Three Financial Statements Link Together?
How the income statement, balance sheet and cash flow statement connect — profit, working capital, capex, debt and cash — in one worked month.
Key takeaways
- The three statements are one set of books seen three ways: performance over a period, position on a date, and how cash moved between two dates.
- Two links hold everything together: net profit flows into retained earnings, and the cash flow statement ends at the cash on the balance sheet.
- Working capital, equipment, loans and owner distributions all move cash without moving profit by the same amount. That’s why profit and cash rarely match.
- Cash on the balance sheet comes from the cash flow statement, never as a balancing figure. Built that way, a balance sheet that balances is a real check.
The question I usually get: “My accountant sends me three reports every month. How do they actually fit together?”
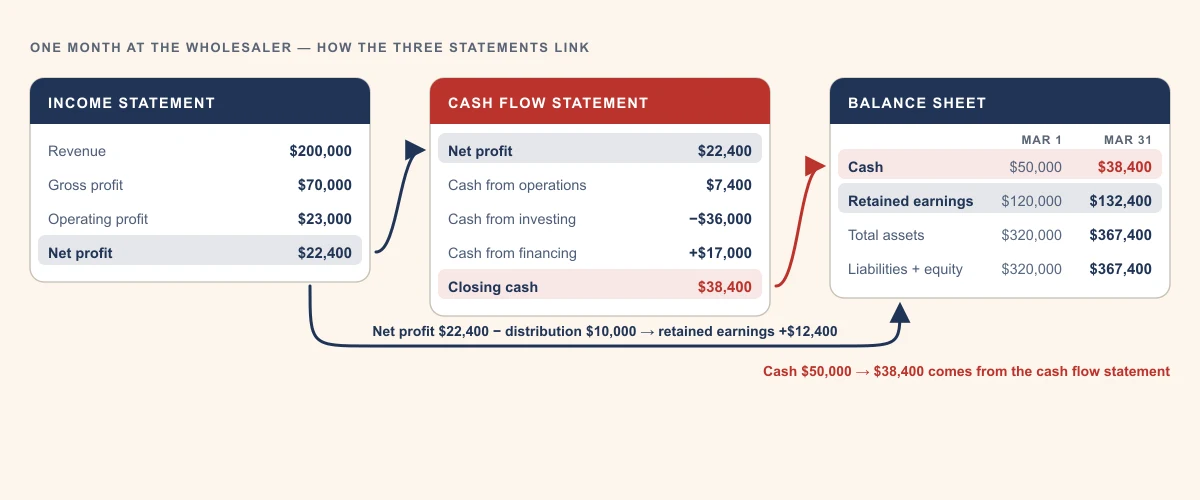
They’re one set of books, seen three ways. Net profit from the income statement is added to retained earnings on the balance sheet, and the cash flow statement explains how the cash on one balance sheet became the cash on the next. Everything else is detail on those two links.
That matters because each statement on its own can mislead. A profit can sit next to a falling bank balance. A balance sheet can look strong while the cash in it is shrinking. Read together, they tell you why.
This piece builds the links up from one $100 sale to one full month, with every balance sheet line traced from March 1 to March 31. If you want to know why profit and cash differ in the first place, start with why a profitable business runs out of cash; the two ways to present the cash flow statement are covered in direct vs indirect.
The model is two equations:
What each statement shows
The income statement covers a period. The balance sheet is a single date. The cash flow statement covers the same period as the income statement and explains the change in cash between two balance sheets.
| Statement | The question it answers | Covers |
|---|---|---|
| Income statement (profit and loss) | Did the business make money? | A period — a month, a year |
| Balance sheet | What does it own, what does it owe, and what belongs to the owners? | One date — the end of the period |
| Cash flow statement | Where did the cash come from and where did it go? | The same period, split into operating, investing and financing |
The balance sheet always balances: assets = liabilities + equity. Every transaction touches at least two places, so it stays balanced. That’s what makes the three statements a single system rather than three separate reports.
Example 1: one $100 sale
The smallest example that shows the links. You invoice a customer $100 for work done, on credit. Later, they pay.
The day you invoice. Revenue goes up $100, so profit goes up $100. On the balance sheet, accounts receivable goes up $100 — and so does retained earnings, through the profit. Cash doesn’t move.
| On the day you invoice | Income statement | Balance sheet | Cash flow statement |
|---|---|---|---|
| Revenue | +$100 | ||
| Accounts receivable | +$100 (asset) | ||
| Retained earnings | +$100 (equity) | ||
| Net profit, less increase in receivables | $100 − $100 = $0 |
The day the customer pays. Cash goes up $100 and receivables go down $100. Nothing happens on the income statement: the revenue was already recorded.
| On the day they pay | Income statement | Balance sheet | Cash flow statement |
|---|---|---|---|
| Revenue | — | ||
| Cash | +$100 | ||
| Accounts receivable | −$100 | ||
| Decrease in receivables | +$100 |
Over the two days, revenue is $100 and cash is $100 — but they arrived at different times. The balance sheet held the difference as a receivable, and the cash flow statement explained it. It’s also why collecting faster raises cash without raising profit — see how reducing DSO improves cash flow. Every link in a full month works the same way.
Example 2: a month at the Wholesaler
One business, one month of everyday transactions — and the three statements built from them, each one tying to the others.
Let’s take a small specialty wholesaler — I’ll call it the Wholesaler — turning over about $2.4 million a year. It starts March with this balance sheet:
| Opening balance sheet, March 1 | |||
|---|---|---|---|
| Cash | $50,000 | Accounts payable | $70,000 |
| Accounts receivable | $120,000 | Loan | $80,000 |
| Inventory | $90,000 | Owner’s capital | $50,000 |
| Equipment (net) | $60,000 | Retained earnings | $120,000 |
| Total assets | $320,000 | Total liabilities and equity | $320,000 |
During March, ten things happen. The last column shows what each one does to the bank balance:
| # | What happened | Cash |
|---|---|---|
| 1 | Sells $200,000 of goods on credit; those goods cost it $130,000 | — |
| 2 | Collects $185,000 from customers | +$185,000 |
| 3 | Buys $140,000 of stock from suppliers on credit | — |
| 4 | Pays suppliers $132,000 | −$132,000 |
| 5 | Pays $45,000 of payroll, rent and other running costs | −$45,000 |
| 6 | Records $2,000 of depreciation on its equipment | — |
| 7 | Draws a new $30,000 bank loan | +$30,000 |
| 8 | Pays the dealer $36,000 for a delivery van | −$36,000 |
| 9 | Makes a loan payment: $3,000 of principal and $600 of interest | −$3,600 |
| 10 | Pays the owner a $10,000 distribution | −$10,000 |
| Change in cash | −$11,600 |
To keep it short, the example ignores income tax.
The income statement
| Income statement, March | From | |
|---|---|---|
| Revenue | $200,000 | #1 |
| Cost of goods sold | −$130,000 | #1 |
| Gross profit | $70,000 | |
| Payroll, rent and running costs | −$45,000 | #5 |
| Depreciation | −$2,000 | #6 |
| Operating profit | $23,000 | |
| Interest | −$600 | #9 |
| Net profit | $22,400 |
Notice what isn’t here: the new loan, the van, the $3,000 of principal and the distribution. None of them is income or an expense. They show up on the balance sheet and in the cash flow statement.
The cash flow statement
This is the indirect presentation — starting from net profit, which US GAAP requires whenever the direct method isn’t used (ASC 230-10-45-28), and the way QuickBooks Online shows it.
| Cash flow statement, March | Where it comes from | |
|---|---|---|
| Net profit | $22,400 | The income statement |
| + Depreciation | +$2,000 | An expense that moved no cash (#6) |
| − Increase in accounts receivable | −$15,000 | Invoiced $200,000 (#1), collected $185,000 (#2) |
| − Increase in inventory | −$10,000 | Bought $140,000 of stock (#3), sold stock that cost $130,000 (#1) |
| + Increase in accounts payable | +$8,000 | Billed $140,000 by suppliers (#3), paid $132,000 (#4) |
| Cash from operating activities | $7,400 | |
| Van | −$36,000 | Paid to the dealer (#8) |
| Cash from investing activities | −$36,000 | |
| New loan | +$30,000 | Drawn from the bank (#7) |
| Loan principal repaid | −$3,000 | The principal part of #9; the $600 of interest is already in net profit |
| Distribution to owner | −$10,000 | #10 |
| Cash from financing activities | +$17,000 | |
| Change in cash | −$11,600 | The same as the ten transactions above |
| Opening cash | $50,000 | The March 1 balance sheet |
| Closing cash | $38,400 | Carried to the March 31 balance sheet |
A profitable month, and cash still fell by $11,600.
The balance sheet, March 1 to March 31
Each line starts from March 1, moves by what the transactions did to it, and ends at March 31. Cash is the one line that isn’t worked out on the balance sheet at all: it’s carried over from the cash flow statement.
| Balance sheet | March 1 | Adjustment | March 31 | What’s adjusted |
|---|---|---|---|---|
| Cash | $50,000 | −$11,600 | $38,400 | From the cash flow statement: +$7,400 operating, −$36,000 investing, +$17,000 financing |
| Accounts receivable | $120,000 | +$15,000 | $135,000 | +$200,000 invoiced (#1), −$185,000 collected (#2) |
| Inventory | $90,000 | +$10,000 | $100,000 | +$140,000 bought (#3), −$130,000 sold (#1) |
| Equipment (net) | $60,000 | +$34,000 | $94,000 | +$36,000 van (#8), −$2,000 depreciation (#6) |
| Total assets | $320,000 | +$47,400 | $367,400 | |
| Accounts payable | $70,000 | +$8,000 | $78,000 | +$140,000 billed (#3), −$132,000 paid (#4) |
| Loan | $80,000 | +$27,000 | $107,000 | +$30,000 drawn (#7), −$3,000 principal repaid (#9) |
| Owner’s capital | $50,000 | — | $50,000 | No new money put in |
| Retained earnings | $120,000 | +$12,400 | $132,400 | From the income statement: +$22,400 net profit, −$10,000 distribution (#10) |
| Total liabilities and equity | $320,000 | +$47,400 | $367,400 |
The two links are both in that table. Retained earnings moves by the income statement’s net profit, less the distribution. Cash moves by the cash flow statement’s total. Every other line moves only by the transactions behind it.
So when both sides come to $367,400, it means something. Nothing was forced to make the balance sheet balance. If cash were simply set to whatever made the two sides agree, the balance sheet would always balance — and prove nothing.
Our free SMB 3-Statement Model is built the same way: its balance sheet takes cash from its own cash flow statement, and a check row flags any year in which the two sides don’t agree.
Where each item lands
Most items touch at least two of the three statements. This is the map — and it’s how you find where a number went.
| Item | Income statement | Balance sheet | Cash flow statement |
|---|---|---|---|
| Sales on credit | Revenue | Receivables up until collected | Increase in receivables subtracted from profit |
| Stock bought on credit | Cost of goods sold when it sells | Inventory up; payables up until paid | Changes in inventory and payables adjust profit |
| Equipment | Depreciation, spread over its life | Equipment at cost less depreciation | Purchase is investing (ASC 230-10-45-13); depreciation added back |
| Loan drawn | — | Loan up | Financing inflow (ASC 230-10-45-14) |
| Loan payment | Interest only | Principal reduces the loan | Principal is financing (ASC 230-10-45-15); interest paid is operating (ASC 230-10-45-17) |
| Distribution to owner | — | Reduces retained earnings | Financing outflow (ASC 230-10-45-15(a)) |
| Net profit | Last line | Added to retained earnings | First line (indirect method) |
| Closing cash | — | Cash | Last line |
For the Wholesaler, the gap between $22,400 of profit and an $11,600 fall in cash is $34,000, and every dollar of it is on that map: $25,000 more in receivables and stock, less $8,000 more owed to suppliers; the $36,000 van, less the $30,000 borrowed for it; $3,000 of principal; and the $10,000 distribution — less the $2,000 of depreciation, which cut profit without moving any cash.
If your balance sheet doesn’t balance, or the cash flow statement doesn’t end at the balance sheet cash, one of these links is broken — usually a transaction posted to the wrong account. Twelve signs your books need a cleanup is where to look.
When an owner shows me a good profit and a worried face, I go straight to the cash flow statement. More often than not the answer is on it in plain sight — receivables growing faster than sales, an equipment purchase paid in cash, a loan being repaid faster than the business can afford. The profit was real. The cash went somewhere else.
Using the links to plan
The same links run forwards. Project the income statement, project the balance sheet, and the cash flow statement follows — which is what a three-statement model is.
A forecast of profit alone can’t tell you whether you’ll run short of cash. Link it to a projected balance sheet — receivables from your collection terms, inventory from your stock plan, the loan from its repayment schedule — and the cash flow statement tells you. With cash taken from the projected cash flow statement — not plugged — a balance check that stays at zero in every period is how you know the links hold.
Our free SMB 3-Statement Model does this a year at a time for five years, for a new business or a new venture — including the costs it runs up before revenue starts. Every link from the Wholesaler’s March has a place in it:
| The link | In the Wholesaler’s March | In the SMB 3-Statement Model |
|---|---|---|
| Net profit → retained earnings | $22,400 of profit, less a $10,000 distribution | Each year’s net income is added to retained earnings. There’s no distributions line, so add one if you pay them |
| Cash flow → balance sheet cash | Closing cash of $38,400 carried to March 31 | The balance sheet’s cash is the cash flow statement’s closing cash, and the next year opens with it |
| Working capital | Receivables, stock and payables moved by the month’s transactions | Receivables, inventory and payables come from the receivable, inventory and payable days you enter; the change each year is the working-capital line in the cash flow statement |
| Equipment | The $36,000 van and $2,000 of depreciation | A fixed-asset schedule: capex goes to investing, depreciation to the income statement and back into operating cash |
| Debt | $30,000 drawn, $3,000 of principal and $600 of interest | A debt schedule: interest to the income statement; the balance split into current maturities and long-term debt; the net change to financing |
| Money from owners | None this month | Equity contributions add to contributed equity and to financing cash |
| The check | Both sides at $367,400 | A check row on the balance sheet reads Ok only when total assets equal total liabilities and equity |
Because the model’s cash comes from its cash flow statement, not from a plug, an Ok in every year means the links hold. Change an assumption — slower collections, a bigger loan, an earlier equipment purchase — and you can watch it move through all three statements at once. Once the year is under way, compare each month’s actuals with the plan — what a useful budget vs actual review shows covers how.
Start this week
Pull last month’s three statements and check the two links yourself. It takes ten minutes.
- Run all three for the same month — the income statement for the month, and the balance sheet at the start and end of it.
- Check the first link: opening retained earnings, plus net profit, less distributions, should equal closing retained earnings.
- Check the second link: the last line of the cash flow statement should equal the cash on the closing balance sheet.
- Read the gap: list what explains the difference between your profit and your change in cash.
Then run the same links forward: download the free SMB 3-Statement Model, enter your own assumptions, and check that the balance sheet reads Ok in every year.
If the links don’t hold in your own reports and you’d like a second pair of eyes, email me at anant@ease.pro. I hope you have a great day.
Want three statements you can actually plan with?
We build linked income statements, balance sheets and cash flow statements on your own numbers — historical and forecast — so the balance sheet balances every month and the cash figure means something. If you’d like experienced finance professionals to build it with you, that’s our financial modeling work.
Frequently asked questions
What are the three financial statements?
The income statement (or profit and loss) shows revenue, costs and profit for a period. The balance sheet shows what the business owns, owes and what belongs to the owners on a single date. The cash flow statement shows how the cash balance moved over the period, split into operating, investing and financing activities.
How do the three financial statements link together?
Net profit from the income statement is added to retained earnings on the balance sheet, less any distributions to owners. The cash flow statement starts from that same net profit, adjusts it for items that did not move cash and for the changes in balance sheet accounts, and ends at the cash figure shown on the closing balance sheet. With cash taken from the cash flow statement rather than plugged, a balance sheet that balances confirms both links.
Why is my profit different from the change in my bank balance?
Because the income statement records sales and costs when they are earned and incurred, not when cash moves. Money tied up in new receivables and inventory, equipment purchases, loan repayments and owner distributions all reduce cash without reducing profit. Depreciation and new borrowing do the opposite. The cash flow statement lists each difference.
Where does depreciation appear in the three statements?
It is an expense on the income statement, it reduces the carrying value of equipment on the balance sheet, and it is added back on the cash flow statement under the indirect method, because no cash left the business when it was recorded. The cash went out earlier, when the equipment was bought, and that payment is an investing outflow.
Where do loan payments go in the financial statements?
A loan payment has two parts. Interest is an expense on the income statement, and under US GAAP the cash paid for interest is an operating outflow (ASC 230-10-45-17). The principal is not an expense: it reduces the loan balance on the balance sheet and is a financing outflow on the cash flow statement.
What is a three-statement model?
A forecast in which the income statement, balance sheet and cash flow statement are projected together and linked, so that projected profit flows into retained earnings and projected cash flows into the balance sheet. With cash taken from the projected cash flow statement rather than plugged, a balance check that stays at zero every period is how you know the links are right. Our free SMB 3-Statement Model is one, built year by year for five years.