How Much Cash Is Tied Up in Accounts Receivable?
Turn accounts receivable and DSO into dollars: the DSO formula, what one day of sales is worth, and how much working capital 15 fewer days would free.
Key takeaways
- Your receivables balance is the cash tied up in accounts receivable: sales you’ve made and not yet been paid for.
- DSO turns it into days. One day of credit sales turns the days back into dollars — and tells you what each day is worth.
- On $5 million of credit sales, one day is about $13,700. Going from 55 days to 40 would cut the working capital tied up in receivables by about $205,000.
- DSO tells you how much cash your receivables hold. It doesn’t tell you which week it will arrive — for that, date each invoice.
Days sales outstanding (DSO) is the average number of days it takes you to get paid after a sale on credit. It matters because every one of those days is money you’ve earned but can’t use: it sits with your customers, and your business has to fund it from its own cash or from borrowing. In practice, DSO tells you three things — how much working capital your receivables need, whether customers are paying slower than your terms, and how much you’d free up by collecting faster.
You look at the balance sheet and see a large accounts receivable number. Then you hear that your DSO is 55 days. The question I usually get next: how much cash is that, really — and how much would I get back if customers paid faster?
Multiply one day of your credit sales by your DSO, and you have the cash tied up in receivables. Multiply it by the days you could cut, and you have the working capital you’d free. The rest of this piece is how to get those two numbers right.
That matters because DSO on its own is just a number of days. Nobody decides to chase harder, change their terms or ask for deposits over “55 days”. They do it over $342,000 sitting with customers who are past their due date.
This piece is about the size of the working capital in your receivables. If DSO, DPO and the cash conversion cycle are new to you, start with where the cash goes. What happens to your cash flow, profit and growth once DSO actually comes down is in how reducing DSO improves cash flow.
The example we’ll use. Let’s say the Distributor sells building supplies to contractors on net 30 terms. Over the last 12 months it made $5,000,000 of credit sales, and its balance sheet shows $753,000 of accounts receivable.
Step 1: Take credit sales and receivables for the same period
You need two figures: accounts receivable on the balance sheet at the end of the period, and credit sales for the same period — usually the last 12 months.
Use credit sales, not total sales. Cash and card sales are paid at once, so they never sit in receivables. Including them makes your customers look faster than they are.
Check the receivables figure, too. Unapplied payments and credit notes leave invoices looking open after the money has arrived. The total should match your AR aging report; using AR aging to forecast collections covers the tie-out.
Example. Credit sales of $5,000,000 for the 12 months; accounts receivable of $753,000 at the end of them.
How to read it. Let’s say the Distributor also took $1,000,000 in cash sales at its trade counter. Divide receivables by all $6,000,000 of sales and DSO comes out under 46 days instead of 55. No customer paid a day sooner. The cash sales simply diluted the figure.
Step 2: Work out DSO
DSO = (accounts receivable ÷ credit sales) × days in the period.
Example. ($753,000 ÷ $5,000,000) × 365 = 55 days.
How to read it. On average, the Distributor waits 55 days to be paid for a sale. Its terms say 30. If you’d rather not work it out by hand, our free working capital calculator gives you DSO alongside DPO, DIO and the cash conversion cycle.
Step 3: Turn one day into dollars
Divide annual credit sales by 365. That’s what one day of DSO is worth to you.
Example. $5,000,000 ÷ 365 = $13,699 a day. Every day the Distributor’s customers take to pay keeps about $13,700 of its cash in their bank accounts.
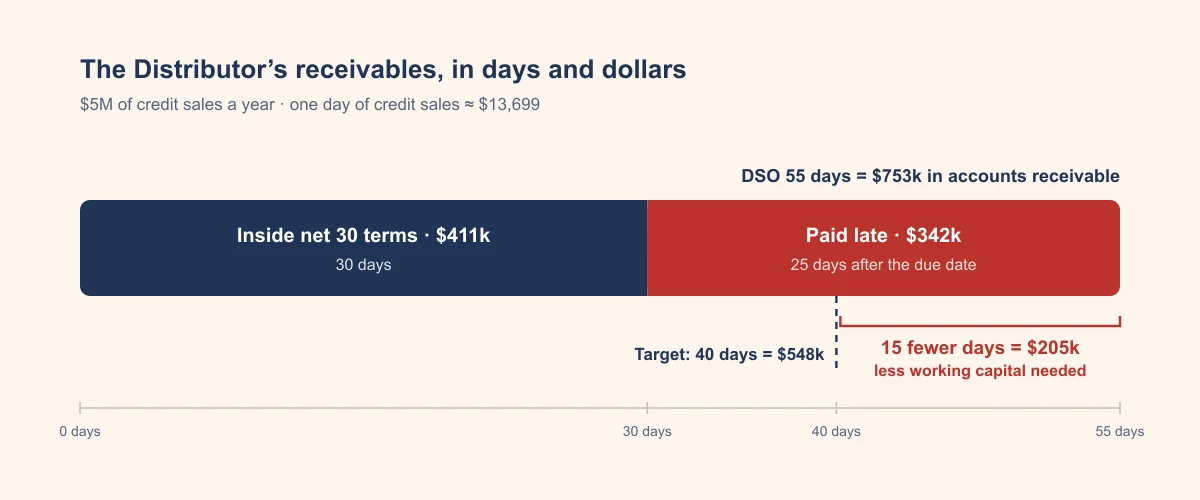
How to read it. This is the number that makes DSO useful. 55 days × $13,699 is the $753,000 on the balance sheet — the two describe the same cash, in days and in dollars.
Step 4: Split it into your terms and what’s late
Your payment terms are the part of DSO you chose. Anything above them is customers paying after the due date.
Example.
| The Distributor’s 55 days | Days | Cash tied up |
|---|---|---|
| Inside its net 30 terms | 30 | $411,000 |
| Paid after the due date | 25 | $342,000 |
| Accounts receivable | 55 | $753,000 |
How to read it. The $411,000 is the cost of selling on net 30. You can only change it by changing your terms. The $342,000 is cash customers are holding past the date they agreed to, and that’s where to start.
This split is an average. It assumes sales were spread evenly and every customer pays at the same speed. Which customers are actually late, and by how much, is in your aging report and your payment history. Our free AR payment behavior analysis template works that out customer by customer.
Step 5: Work out how much working capital a lower DSO would free
Pick a DSO you could realistically reach, take it from today’s, and multiply the difference by one day of credit sales.
A realistic target is usually your own DSO a year or two ago, or your terms plus the delay your good customers take. Zero late days is rarely realistic.
Example. Let’s say the Distributor’s DSO was 40 days two years ago:
| DSO | Accounts receivable |
|---|---|
| Today — 55 days | $753,000 |
| Target — 40 days | $548,000 |
| Less working capital needed — 15 days × $13,699 | $205,000 |
How to read it. The Distributor would run the same business, with the same customers and the same sales, on about $205,000 less working capital — and that money would come out of receivables and into the bank. Even at 40 days, customers would still be paying 10 days after the due date.
That lower requirement lasts for as long as DSO stays at 40, and it means growth needs less new capital too. That’s covered in how reducing DSO improves cash flow. To see your own receivables fall to the lower level week by week, channel by channel, use our free DSO Cash Impact Calculator.
DSO is a diagnostic, not a weekly forecast
DSO tells you how much working capital your receivables hold and how much a change would free. It doesn’t tell you which week the cash will arrive.
DSO is an average over a whole period, and it moves when your sales move — even if nobody’s paying faster or slower.
Example. Let’s say the Distributor’s customers keep paying in exactly 55 days, but a busy fall means the last two months’ sales run 20% above the year’s average. Receivables are mostly those recent sales, so they rise to about $904,000. Divide by the same $5,000,000 year and DSO reads 66 days.
How to read it. Nobody paid more slowly. More was sold recently. So check DSO against the same month last year, not just last month, before you decide your customers have slowed down.
The same averaging is why DSO can’t give you the week. A forecast needs a date for each invoice — from a promise, from how that customer usually pays, or from the due date. How to forecast cash receipts accurately covers that. Our free AR collection forecast template puts each open invoice in its week.
When I first look at a business’s receivables, I put DSO into dollars in front of the owner before anything else. “25 days late” gets a nod. “$342,000 sitting with customers past their due date” gets a chase list by Friday.
See how your working capital moves before you change anything
Shortening terms or offering an early-payment discount changes how much working capital your receivables hold, sales channel by sales channel. Model it before you commit.
The DSO formula gives you one number for the whole business. Real changes are usually made one channel at a time. You might move wholesale customers from 30 days to 15, or offer a discount to the marketplace.
Our free DSO Cash Impact Calculator does that. Enter your weekly sales by channel, the credit days each channel takes today and the days you’re aiming for, and any early-payment discount. For 13 weeks it shows the receivables balance under both — the working capital they tie up — and the cash collected, so you can see how fast the requirement falls and how much cash that brings in.
Example. In the calculator’s sample, credit days are halved on every credit channel in return for a 1% discount. The weighted collection period falls from 22.4 days to 11.2. Over 13 weeks the business collects $162,337 more cash, after the discount.
How to read it. The extra cash is the working capital that’s no longer tied up in receivables — Step 5, landing week by week. The discount is a cost you pay on every invoice from then on. Whether that trade is worth it is a question for how reducing DSO improves cash flow.
Start this week
Take your last 12 months of credit sales and today’s receivables, work out DSO, and put one day of it into dollars.
Then split it into your terms and what’s late, and write down the dollar figure for the late part. That’s the number to bring to your next collections conversation.
If you’d like a second pair of eyes on your receivables, email me at anant@ease.pro. I hope you have a great day.
Want the cash in your receivables measured and brought down?
Working out the number takes an afternoon. Bringing it down takes a weekly routine — knowing which customers drive the late days, chasing them on time, and setting terms that hold. If you’d like experienced finance professionals to build that from your own ledger and run it with your team, that’s our cash flow work.
Frequently asked questions
What is days sales outstanding (DSO)?
Days sales outstanding is the average number of days it takes you to collect a sale made on credit. A DSO of 55 means your receivables balance equals about 55 days of credit sales — 55 days of sales you've made, invoiced and not yet been paid for.
What is the DSO formula?
DSO = (accounts receivable ÷ credit sales) × days in the period. Use the receivables balance at the end of the period and the credit sales for the same period, for example the last 12 months with 365 days. Leave out cash and card sales, which never sit in receivables.
How do I work out how much cash is tied up in accounts receivable?
Divide your annual credit sales by 365 to get one day of sales. Your receivables balance is that figure times your DSO. The working capital a lower DSO would free is the number of days you cut times one day of sales: on $5 million of credit sales, one day is about $13,700, so 15 fewer days frees about $205,000.
Should DSO use total sales or credit sales?
Credit sales. Cash and card sales are collected at once, so including them makes your customers look faster than they are. On $5 million of credit sales and $753,000 of receivables, DSO is 55 days. Add $1 million of cash sales to the denominator and it reads under 46 — with no customer paying any sooner.
Can I use DSO to forecast my cash collections?
Not week by week. DSO is an average over a period, and it moves when your recent sales rise or fall even if no customer pays faster or slower. It's the right number for asking how much working capital your receivables hold and how much a change would free. For which week the cash arrives, you date each open invoice instead.