How Accurate Should a Cash Flow Forecast Be?
Cash flow forecast accuracy: what 85% accurate means, how headroom keeps cash above your minimum, how to test against actuals, and how to improve.
Key takeaways
- A good cash flow forecast passes two tests: accuracy over a period, and headroom in every week.
- Accuracy: a widely used rule of thumb grades an average error of 10–20% as good, so about 85% accurate is a fair target. Add up the misses ignoring sign and divide by the actual cash.
- Headroom = forecast closing cash − the minimum cash you need to hold. Forecast $40,000, minimum $25,000: $15,000 of headroom. No week’s misses should be bigger than that.
- The headroom test matters more. A forecast’s job is to warn you in time to prepare — if cash drops below your minimum in a week it said was fine, it has failed, whatever its score.
- Add the misses with their sign too — a running total that keeps growing one way means the forecast is biased.
- Keep the forecast realistic, and put your caution where you can see it — minimum cash and a downside case — not in every line.
- Improve accuracy by cleaning the data and aligning the assumptions, and review actual against forecast every week.
The question I get once a forecast has run for a few weeks: how accurate should this be — and how do I know if mine is?
A good forecast passes two tests. Over a period, it’s about 85% accurate. And in every week, its misses are small enough that your actual cash never drops below the minimum you need to hold. The second test matters more. The point of a forecast is to see a tight week coming and prepare for it. If cash drops below your minimum in a week the forecast said was fine, it has failed at the one thing it’s for — whatever its score.
You won’t get 100%. Customers decide when they pay, and some of them change their minds. What you control is how realistic your assumptions are, and how quickly you correct them when the bank says otherwise.
This piece is about cash flow forecast accuracy: the two tests, where the 85% figure comes from, how to test your forecast against actuals, how conservative to be, and how to improve. If you haven’t built a forecast yet, start with the full weekly build.
The two tests: accuracy and headroom
Accuracy tells you how close the forecast is overall. Headroom tells you whether a miss in any one week would push you below your minimum cash. Both are simple sums.
Test 1: accuracy
Let’s say $100,000 actually came in over a month, and your weekly misses add up to $15,000, ignoring whether each was over or under. Accuracy is 100% − ($15,000 ÷ $100,000) = 100% − 15% = 85%.
Test 2: headroom
Let’s say your forecast shows $40,000 in the bank at the end of next week, and the minimum you never want to go below is $25,000. Your headroom that week is $40,000 − $25,000 = $15,000. That’s how much the week can go wrong before you’re below your minimum.
- A $10,000 customer payment slips to the following week: you close at $30,000. Still $5,000 above the minimum. The forecast did its job.
- A $20,000 payment slips: you close at $20,000. That’s $5,000 below the minimum, in a week the forecast said was fine.
So the test is: in every week, the misses up to that week — net of any that have come back — should never be bigger than that week’s headroom. Where headroom is wide, a rough forecast is fine. Where it’s thin, that week needs your most careful numbers, and it’s the week to prepare for in advance — chase a receipt early, move a payment, or line up your credit facility.
What “85% accurate” actually means
It means your misses, added up over a period, come to about 15% of the actual cash. It’s a rule of thumb from forecasting research, not an accounting standard — useful, as long as you know where it comes from.
The scale most people quote comes from Colin Lewis’s 1982 book on business forecasting. He graded forecasts by their average percentage error:
| Average error | Lewis’s grade | Accuracy |
|---|---|---|
| Under 10% | Highly accurate | Over 90% |
| 10–20% | Good | 80–90% |
| 20–50% | Reasonable | 50–80% |
| Over 50% | Inaccurate | Under 50% |
So 85% sits in the middle of “good”. Two things to keep in mind, though.
First, it’s a general scale for any forecast — sales, demand, cash. Nobody has published an independent accuracy benchmark for small business cash forecasts, and the targets you’ll see quoted online (95%, “under 5% in the first four weeks”) mostly come from software vendors.
Second, the number depends on how you measure it. Lewis’s measure averages each week’s percentage error. That breaks down for cash: a week with very little coming in turns a small dollar miss into a huge percentage, and a week with nothing coming in can’t be measured at all — a problem Hyndman and Koehler set out in 2006. For cash, use the weighted version in Test 1 above: total misses divided by total actual cash. Big weeks count for more than small ones, which is exactly how your bank account feels them.
Three kinds of forecast error
Every gap between forecast and actual is one of three things. Telling them apart is most of the work.
| Type | What happened | Does it come back? | What to fix |
|---|---|---|---|
| Timing | The right amount, in the wrong week | Yes — it lands in another week | The date assumption |
| Amount | The total itself was different | No | The amount assumption |
| Missed item | Something wasn’t in the forecast at all | No | The list of what you forecast |
How to test forecast accuracy against actuals
Save each week’s forecast, then compare it with what actually came in and went out over a period. A quarter is a good test. One week tells you very little.
- Save the forecast before you roll it forward. You can’t test a forecast you’ve overwritten. A copy of each week’s version is enough.
- Compare like with like. Test the forecast you made one week ahead separately from the one you made four weeks ahead. The second will be less accurate — that’s expected, for the reasons in why the later weeks are less exact.
- Test receipts and payments separately. Netting them lets a short receipt hide behind a late payment.
- Look at three things: the accuracy score, the direction of the misses, and the worst week against its headroom.
Example 1: six weeks of receipts
Let’s say this is a business’s receipts forecast, each made a week ahead, against what actually arrived. I’ve used six weeks so it fits on the page — for your own test, use the quarter.
| Week | Forecast | Actual | Miss | Running total of misses |
|---|---|---|---|---|
| 1 | $100,000 | $108,000 | +$8,000 | +$8,000 |
| 2 | $120,000 | $90,000 | −$30,000 | −$22,000 |
| 3 | $95,000 | $125,000 | +$30,000 | +$8,000 |
| 4 | $110,000 | $104,000 | −$6,000 | +$2,000 |
| 5 | $105,000 | $112,000 | +$7,000 | +$9,000 |
| 6 | $115,000 | $106,000 | −$9,000 | $0 |
| Total | $645,000 | $645,000 |
The misses, ignoring sign, add up to $90,000. That’s 14% of the $645,000 that arrived, so the forecast is about 86% accurate — in Lewis’s “good” band. And the running total ends at zero. The misses go both ways, so there’s no bias.
Example 2: the same score, but every miss runs short
Now take the same six weeks of actual receipts, against a forecast built from the sales team’s expected collections — which ran ahead of what customers paid, every week.
| Week | Forecast | Actual | Miss | Running total of misses |
|---|---|---|---|---|
| 1 | $120,000 | $108,000 | −$12,000 | −$12,000 |
| 2 | $108,000 | $90,000 | −$18,000 | −$30,000 |
| 3 | $135,000 | $125,000 | −$10,000 | −$40,000 |
| 4 | $124,000 | $104,000 | −$20,000 | −$60,000 |
| 5 | $126,000 | $112,000 | −$14,000 | −$74,000 |
| 6 | $122,000 | $106,000 | −$16,000 | −$90,000 |
| Total | $735,000 | $645,000 |
The misses, ignoring sign, still add up to $90,000 — the same 86% accurate. But every one runs the same way, and the running total keeps falling. Over the six weeks, $90,000 less came in than this forecast said. In Example 1, the shortfall is zero.
Same score. Very different forecast. A shortfall that grows every week will sooner or later be bigger than your headroom — that’s how a biased forecast fails the second test.
Spotting bias: do the misses keep running one way?
Watch the running total of misses — the last column in the tables above. If it keeps bouncing around zero, your misses are random. If it keeps growing in one direction, your forecast leans that way.
To know when it’s gone too far, compare the running total with your typical weekly miss.
In Example 2, the typical miss is $15,000. By week 4, the running total is −$60,000 — four typical misses, all short. That isn’t bad luck any more. An assumption is wrong, and week 4 is the time to fix it, not week 13. In Example 1, the running total never gets beyond $22,000, about one and a half typical misses, and it ends at zero.
The simplest version: if your forecast has come in short four weeks in a row, stop and find out why.
Headroom: when a good score still hides a bad week
Example 1 passed the accuracy test — 86%, with no bias. It still had a week that broke the business’s minimum cash. It failed the headroom test.
Example 3: $30,000 slips a week
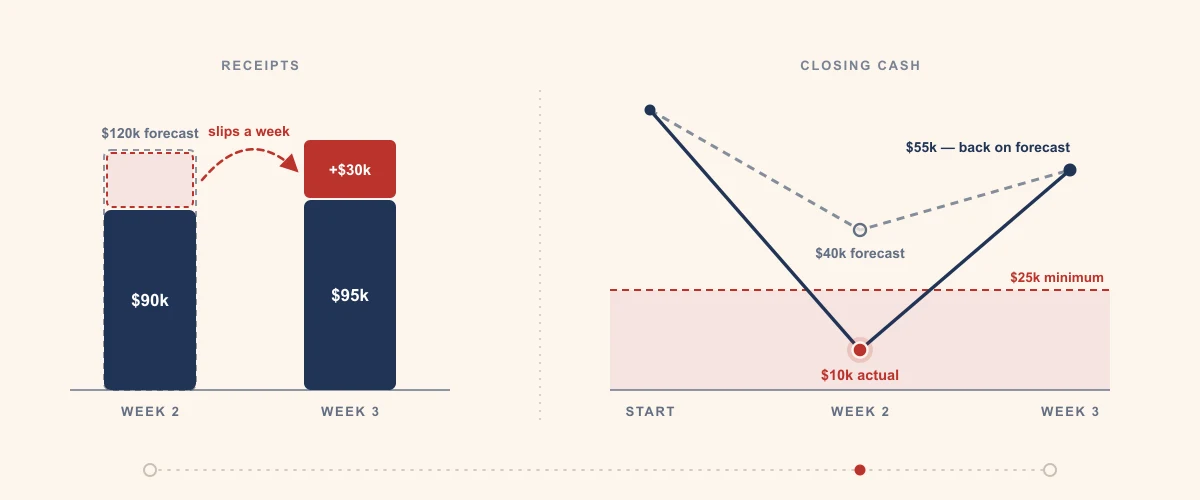
This is the headroom example from the top — $40,000 forecast, $25,000 minimum, $15,000 of headroom — with a bigger miss. Look at weeks 2 and 3 of Example 1. The business starts week 2 with $70,000 in the bank, pays out $150,000 that week (payroll and suppliers) and $80,000 in week 3, and never wants to drop below $25,000.
| Week 2 forecast | Week 2 actual | Week 3 forecast | Week 3 actual | |
|---|---|---|---|---|
| Receipts | $120,000 | $90,000 | $95,000 | $125,000 |
| Closing cash | $40,000 | $10,000 | $55,000 | $55,000 |
The forecast gave week 2 $15,000 of headroom above the minimum. The miss was $30,000 — twice that. So for one week, the business sat $15,000 below its minimum, with payroll due. Over the two weeks the receipts add up exactly, and the six-week score is good. Neither one tells you about that week — and that week is the one the forecast was for.
Example 4: the same miss, but the $30,000 never comes
Now suppose the customer short-pays instead, and the $30,000 doesn’t arrive at all. Week 3 closes at $25,000 instead of $55,000 — right at the minimum, with no headroom left. And unlike Example 3, it doesn’t recover: every later week starts $30,000 lower than the forecast says, until you correct it.
Timing error
- Matters when it’s bigger than that week’s headroom
- Reverses on its own
- Fix: the date you expect the cash
Amount error
- Always matters — it carries into every later week
- Doesn’t reverse
- Fix: the amount, and the assumption behind it
Should a cash flow forecast be conservative?
Realistic in the forecast, conservative in the decisions. Build every line on what your history says will happen, then put your caution in one place you can see.
The instinct to be conservative is right. Running short of cash costs far more than holding a little too much, and forecasting theory backs that up: when one kind of miss costs more than the other, the best number to plan with leans away from the costly one. Clive Granger showed this in 1969.
Where it goes wrong is shading every line. Take 10% off each receipt and add a week to every customer, and three things happen:
- You don’t know how much cushion you’ve built in. Small haircuts on many lines over many weeks add up to a number nobody chose.
- The review stops working. Every miss looks like good news, so when customers really do slow down, you can’t tell.
- You decide on the wrong cash — holding back a purchase, or drawing on a credit line you didn’t need.
So build the base case realistically: receipts dated by how each customer actually pays, amounts and seasonality from your own history, and payments on the dates you’ll actually make them. Then put the caution where you can see it:
- Minimum cash. The balance you never go below, chosen with a reason. Headroom is measured against it, so this is where most of your caution belongs.
- A downside case. The same forecast, with your two or three largest customers paying two weeks late. If that case breaks the minimum, you know which week to prepare for.
- Later dates where you have no history. A new customer gets the later end of what’s reasonable until they’ve paid you a few times.
Accountants draw a similar line in financial reporting. The IASB’s Conceptual Framework describes prudence as caution when making judgements under uncertainty — and says it doesn’t permit understating assets or income any more than overstating them. Caution, yes. Quietly shading the numbers, no.
How to improve cash flow forecast accuracy
When the tests show a problem, the fix is almost always in one of two places: the data underneath, or the assumptions on top. These are the cash flow forecasting best practices that matter most.
Clean the underlying data
- Reconcile the opening balance. If the bank and the books disagree, every week is wrong by the same amount. Clean up the books before you measure anything.
- Strip one-offs out of history before you average it. A one-time $40,000 equipment sale in last quarter’s receipts will inflate every weekly average built from it.
- Classify actuals the same way you forecast. If a supplier refund lands under customer receipts, the variance shows up on the wrong line and you fix the wrong assumption.
- Keep the saved forecasts. They’re the data for the accuracy test.
Align the assumptions
- With history. Payment dates from what customers actually do, not their terms. Seasonality from the same weeks last year.
- With the trend. If customers have been paying a few days slower each month, the forecast should too.
- With the people who know. Sales knows which big order is slipping; operations knows when the next stock order lands. Give each line one owner.
- With each other. If you forecast sales up 20%, supplier payments and payroll should move too. Receipts rising on their own means the assumptions don’t describe the same business.
The weekly actual-vs-forecast review
This is where the tests and the fixes happen. About half an hour, every week, before you roll the forecast forward.
- Put actuals next to the forecast, line by line. Not just the total — the total hides timing errors.
- Classify each material difference as timing, amount or a missed item. Set a threshold so the review stays short.
- Ask why, and give each one an owner. “Receipts were short” isn’t a reason. “One customer paid a week late because of its payment run” is.
- Fix the assumption, not just the number, so next week’s forecast doesn’t repeat the miss.
- Save this week’s version, then roll forward: drop the finished week, add a new week thirteen.
A review log can be this simple:
| Line | Variance | Type | Fix |
|---|---|---|---|
| Customer receipts, week 2 | −$30,000 | Timing | Date that customer to its payment run |
| Card processing fees | −$600 | Amount | Update the fee rate in the forecast |
| Insurance renewal | −$12,000 | Missed item | Add annual items to the forecast calendar |
For receipts specifically, I’ve covered how to check them customer by customer in how you know your receipts forecast is accurate.
Start this week
Set your minimum cash, start saving your forecasts, and run the three tests as soon as you have a few weeks to compare.
- Decide your minimum cash — the balance you never want to go below.
- Save this week’s forecast before you roll it forward, and every week after.
- Once you have a few weeks, line the saved forecasts up against actuals and work out the score, the running total of misses, and the worst week against its headroom.
- Fix one assumption before you roll forward. Then do it again next week.
If you’d like a second pair of eyes on your forecast-versus-actual review, email me at anant@ease.pro. I hope you have a great day.
Want the weekly review run with you?
Building a forecast is one job. Keeping it honest every week — comparing it with the bank, finding why each week was off, and fixing the assumption — is what makes it accurate. If you’d like experienced finance professionals to run that review with your team, that’s our cash flow work.
Frequently asked questions
How accurate should a cash flow forecast be?
It has to pass two tests. Over a period, about 85% accurate is a fair target — a widely used rule of thumb from forecasting research grades an average error of 10–20% as good. And in every week, the misses shouldn't be bigger than that week's headroom, so your actual cash never drops below the minimum you need to hold. The second test matters more: a forecast that lets cash fall below the minimum without warning has failed at its job, whatever its score.
What is headroom in a cash flow forecast, and how do you calculate it?
Headroom is forecast closing cash minus the minimum cash you need to hold. If your forecast shows $40,000 at the end of next week and your minimum is $25,000, your headroom is $15,000 — the amount that week can go wrong before you're below your minimum.
How do you test cash flow forecast accuracy?
Save each week's forecast before you roll it forward, then compare it with actual receipts and payments over a period — a quarter is a good test. Add up the misses ignoring sign, divide by the actual cash, and take that from 100%. Then add the misses with their sign: if the running total keeps growing in one direction, the forecast is biased.
What is the difference between timing error and amount error?
A timing error is cash that arrives or leaves in a different week than forecast but in the right amount — a customer who pays a week late. It reverses. An amount error means the total changed — a customer short-pays or never pays. It doesn't reverse, and it carries into every later week until you correct the forecast.
Should a cash flow forecast be conservative?
Realistic in the forecast, conservative in the decisions. Build each line on what your history says will happen, then hold your caution in places you can see — a minimum cash balance and a downside case. Shading every line hides how much cushion you have and stops the weekly review from showing when customers really slow down.
How do you improve cash flow forecast accuracy?
Clean the underlying data — reconcile the opening balance, strip one-offs out of history, and classify actuals the same way you forecast — and align the assumptions with your history, the trend, the people who know, and each other. Then review actual against forecast every week and fix the assumption behind each material miss.
What are the most common cash flow forecasting challenges?
Optimistic customer receipts, small recurring payments left out, an opening balance from books that aren't reconciled, a forecast that isn't rolled forward every week, and judging accuracy only on totals. Each one has a straightforward fix, and a weekly actual-vs-forecast review is what finds them.